mxGraph是使用SVG和HTML进行渲染的完全客户端JavaScript图形库。
mxGraph 支持IE 11, Chrome 43+, Firefox 45+, Safari 10 and later, Opera 30+,未使用第三方JS.mxGraph提供后端.net、java的接口,以支持在后端进行图形的修改、图形I/O、图形布局.
Hello World 1 2 3 4 5 6 7 8 9 10 11 12 13 14 15 16 17 18 19 20 21 22 23 24 25 26 27 28 29 30 31 32 33 34 35 36 37 38 39 40 41 42 43 44 45 46 47 48 49 50 51 52 53 54 55 56 57 58 59 60 61 62 63 64 65 66 <html > <head > <title > Hello, World! example for mxGraph</title > <script type ="text/javascript" > mxBasePath = '../src' ; </script > <script type ="text/javascript" src ="../src/js/mxClient.js" > </script > <script type ="text/javascript" > function main (container ) { if (!mxClient.isBrowserSupported()) { mxUtils.error('Browser is not supported!' , 200 , false ); } else { var graph = new mxGraph(container); new mxRubberband(graph); var parent = graph.getDefaultParent(); mxEvent.disableContextMenu(ele); graph.getModel().beginUpdate(); try { var v1 = graph.insertVertex(parent, null , 'Hello,' , 20 , 20 , 80 , 30 ); var v2 = graph.insertVertex(parent, null , 'World!' , 200 , 150 , 80 , 30 ); var e1 = graph.insertEdge(parent, null , '' , v1, v2); } finally { graph.getModel().endUpdate(); } } }; </script > </head > <body onload ="main(document.getElementById('graphContainer'))" > <div id ="graphContainer" style ="overflow:hidden;width:321px;height:241px;background:url('editors/images/grid.gif')" > </div > </body > </html >
Container mxGraph渲染容器. 应该将一个DOM对象作为参数实例化 mxGraph:
1 var graph = new mxGraph(document .getElementById('graphContainer' ));
Vertex 和 Edge mxGraph是个图形编辑库,图形实际是有两个元素组成:节点(Vertex)和边(Edge).
mxGraph中新增节点和边最常用的方式:
1
2
3
var v1 = graph.insertVertex(root, null ,'Hello,' , 20 , 20 , 80 , 30 );var v2 = graph.insertVertex(root, null ,'World!' , 200 , 150 , 80 , 30 );var e1 = graph.insertEdge(root, null , '' , v1, v2);
parent mxGraph容器内的内容是个树形结构,树的顶点就是通过容器获取的根节点:
1
2
var graph = new mxGraph(container);var root = graph.getDefaultParent();
每个节点和边都应该有个父元素. 而节点(Vertex)是可以作为其他节点的父元素.
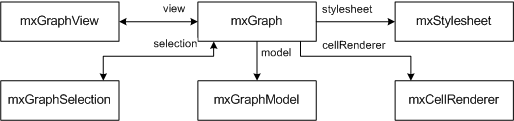
Graphs 初始化new mxGraph(DOM)将得到mxGraph.以mxGraph为核心,提供对图(Graph)各种(图形,样式,图的缩放等)操作的API.通过mxGraph可以获取到其他API对象.
mxGraph 可以直接操作 图形的方法.例如:
⚠️对图形的操作或获取图形的信息都可以在 mxGraph 进行.
获取mxGraphModal通过mxGraph.getModel()
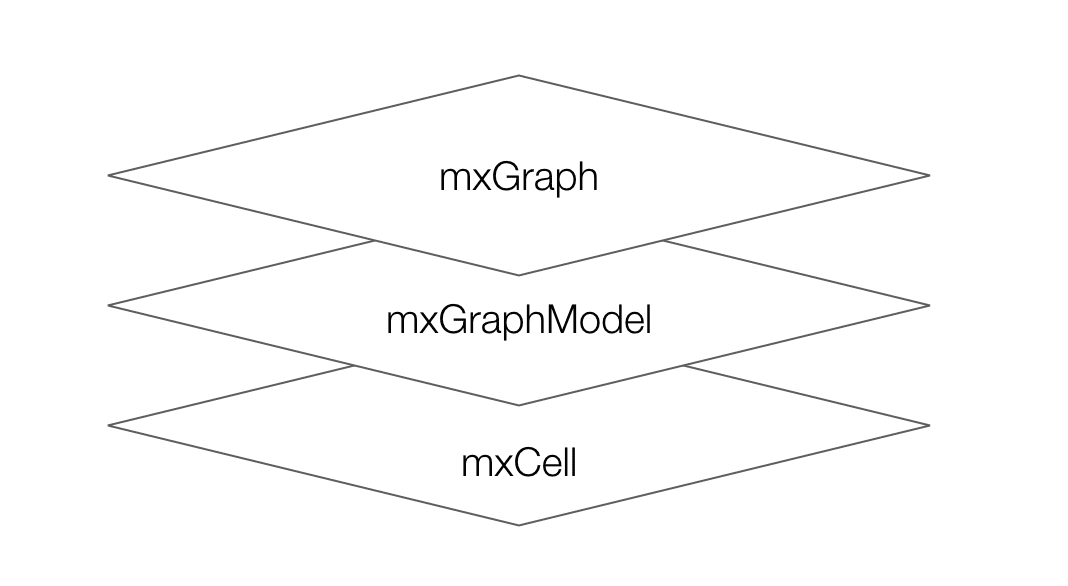
图形的数据信息实际上都保存在mxGraphModel中, 而图形两个展示元素 节点(vertex)和连接线(edge)信息是保存在mxCell 中.
mxGraph和mxGraphModal、mxCell关系如下图:
mxGraph.insertVertex创建一个节点的方法,实际上是调用 mxCell实现的.
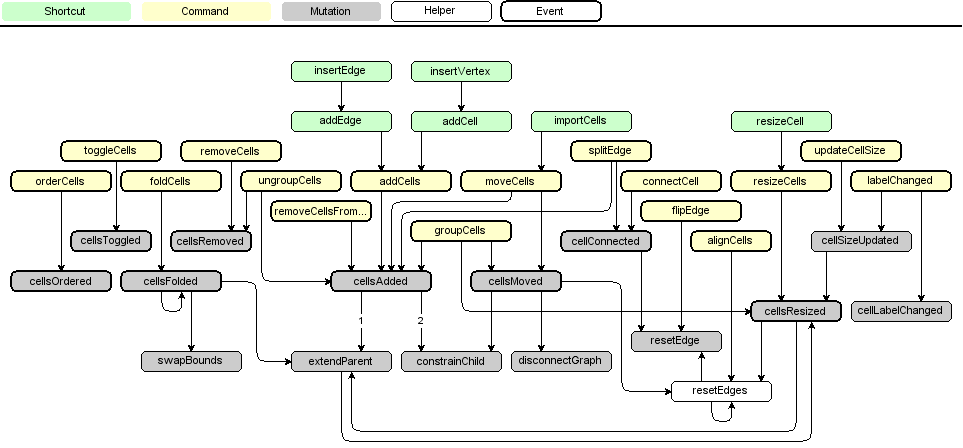
mxGraph中对图形(节点、连接线)操作的方法调用时序图如下:
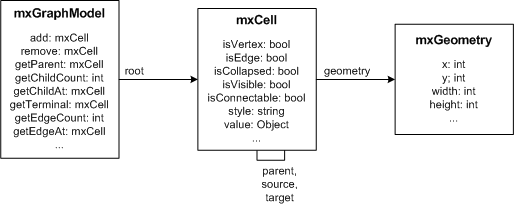
对节点和连接线的操作都可以在mxGraphModel中进行.
⚠️mxGeometry
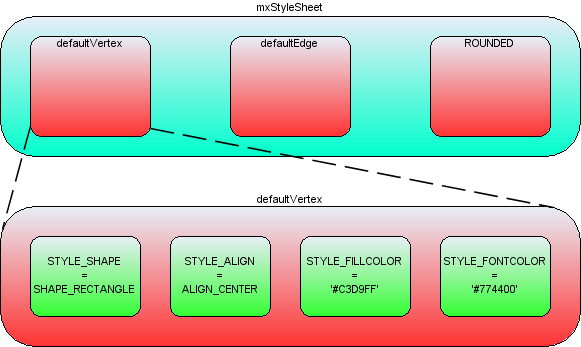
mxStylesheet定义了cell(节点、连接线)的样式.它实际上是个Object对象,key是字符串,value是个数组. 默认存在两个值defaultVertex和defaultEdge.
图形上可修改的样式种类,都定义在mxConstantsSTYLE_开头的字符串是各种样式定义字符串。一些样式应用到节点上,一些适用于节点,一些适用于连线,一些都适用。
mxStylesheet获取通过graph.getStylesheet().
给cell定义一个新的style 1 2 3 4 5 var style = new Object ();style[mxConstants.STYLE_SHAPE] = mxConstants.SHAPE_RECTANGLE; style[mxConstants.STYLE_OPACITY] = 50 ; style[mxConstants.STYLE_FONTCOLOR]= '#774400' ; graph.getStylesheet().putCellStyle('ROUNDED' ,style);
putCellStylemxStylesheet中保存一个新的样式类型
在cell上使用一个新的style
1 var v1 = graph.insertVertex(parent, null , 'Hello' , 20 , 20 , 80 , 30 , 'ROUNDED' );
cell上使用一个新的style,但重写部分样式
1 var v1 = graph.insertVertex(parent, null , 'Hello' , 20 , 20 , 80 , 30 , 'ROUNDED;strokeColor=red;fillColor=green' );
创建一个没有使用默认样式的cell
1 var v1 = graph.insertVertex(parent, null , 'Hello' , 20 , 20 , 80 , 30 , ';strokeColor=red;fillColor=green' );
创建一个使用默认样式,但重写部分样式
1 var v1 = graph.insertVertex(parent, null , 'Hello' , 20 , 20 , 80 , 30 , 'defaultVertex;fillColor=blue' );
mxGraphView控制着图view上的几何信息和图形的状态信息.通过mxGraphView可以监听到图的缩放或移动信息.
获取mxGraphView方式: mxGraph.getview()
mxCellRenderer是cell(图形)的渲染器,一般用来创建、重新绘制、销毁cell的形状或标签.
Event mxGraph中有三种类型的事件:
mxGraph中mxGraphModel , mxGraph , mxGraphView , mxEditor , mxCellOverlay , mxToolbar , mxWindow 继承于mxEventSource.
原生DOM事件监听 1 mxEvent.addListener(DOM,eventType,mxUtils.bind(this , function (evt )
mxEventSource中触发mxEventObjects 1 graph.addListener(mxEvent.MOVE_CELLS, function (sender,evt )
mxGraph中触发mxMouseEvent 1 2 3 4 5 this .graph.addMouseListener({ mouseDown : mxUtils.bind(this , function (sender, me ) mouseMove : mxUtils.bind(this , function (sender, me ) mouseUp : mxUtils.bind(this , function (sender, me ) });
mx事件 1 2 3 4 5 6 7 8 9 10 11 12 13 14 15 16 17 18 19 20 21 22 23 24 25 26 27 28 29 30 31 32 33 34 35 36 37 38 39 40 41 42 43 graph.addListener(mxEvent.CLICK, (_graph: any, evt: any ) => { var cell = evt.getProperty("cell" ); if (!!cell && EventCell._oneClickFn) { EventCell._oneClickFn.apply(graph, [cell, _graph]); } }); graph.addListener(mxEvent.DOUBLE_CLICK, (_graph: any, evt: any ) => { var cell = evt.getProperty("cell" ); if (!!cell && EventCell._doubleClickFn) { EventCell._doubleClickFn.apply(graph, [cell, _graph]); } }); graph .getSelectionModel() .addListener(mxEvent.CHANGE, (sender: any, evt: any ) => { let cells = sender.cells || []; let properties = evt.properties; if ( properties && properties.added && properties.added.length && EventCell._blurCellFn ) { let adds = properties.added; for (let cell of adds) { EventCell._currentCell = "" ; EventCell._blurCellFn!.apply(sender.graph, [cell, sender.graph]); } } if (EventCell._focusCellFn) { for (let cell of cells) { EventCell._currentCell = cell; EventCell._currentGraph = sender.graph; EventCell._focusCellFn!.apply(sender.graph, [cell, sender.graph]); } } });
常用方法 Style的使用 1 2 3 4 5 6 7 8 9 10 11 12 13 14 15 16 17 18 19 20 21 22 23 24 25 26 27 28 29 30 31 32 33 34 35 36 37 38 39 40 41 42 43 var style = {}; style = mxUtils.clone(style); style[mxConstants.STYLE_SHAPE] = mxConstants.SHAPE_LABEL; style[mxConstants.STYLE_STROKECOLOR] = '#999999' ; style[mxConstants.STYLE_STROKEWIDTH] = 10 ; style[mxConstants.STYLE_FONTCOLOR] = '#FFFF00' ; style[mxConstants.STYLE_ALIGN] = mxConstants.ALIGN_CENTER; style[mxConstants.STYLE_VERTICAL_ALIGN] = mxConstants.ALIGN_BOTTOM; style[mxConstants.STYLE_FONTSIZE] = 30 ; style[mxConstants.STYLE_IMAGE_ALIGN] = mxConstants.ALIGN_CENTER; style[mxConstants.STYLE_IMAGE_VERTICAL_ALIGN] = mxConstants.ALIGN_CENTER; style[mxConstants.STYLE_IMAGE] = 'http://imgstatic.baidu.com/img/image/shouye/qizhi0822.jpg' ; style[mxConstants.STYLE_IMAGE_WIDTH] = 150 ; style[mxConstants.STYLE_IMAGE_HEIGHT] = 200 ; style[mxConstants.STYLE_SPACING_TOP] = 30 ; style[mxConstants.STYLE_SPACING] = 10 ; style[mxConstants.STYLE_FOLDABLE] = 0 ; graph.getStylesheet().putCellStyle("style1" , style); var v1 = graph.insertVertex(parent, null , "text1" , 50 , 50 , 200 , 200 , "style1" ); graph.setCellStyle(mxUtils.trim("selectCell" ), [cell]);
画布缩放 1 2 3 4 5 6 7 8 9 10 11 12 13 14 15 16 17 18 19 20 21 22 23 graph.centerZoom = true ; document .body.appendChild(mxUtils.button('放大 +' , function (evt ) graph.zoomIn(); })); document .body.appendChild(mxUtils.button('缩小 -' , function (evt ) graph.zoomOut(); })); document .body.appendChild(mxUtils.button('还原 #' , function (evt ) graph.zoomActual(); graph.zoomFactor = 1.2 ; input.value = 1.2 ; })); var input = document .createElement("input" ); input.type = "text" ; input.value = graph.zoomFactor; input.addEventListener("blur" , function ( graph.zoomFactor = parseFloat (this .value, 10 ); }); document .body.appendChild(input);
拖拽连线 1 2 3 4 5 6 7 8 9 10 11 12 13 14 15 new mxRubberband(graph); graph.setConnectable(true ); graph.setCellsEditable(false ); mxGraphHandler.prototype.guidesEnabled = true ; graph.setEnabled(true ); graph.setAllowDanglingEdges(false ); graph.setCellsLocked(false ); graph.setMultigraph(false );
设置Vertex上的连接点,设置连接点图标 1 2 3 4 5 6 7 8 9 10 11 12 13 14 15 16 17 18 19 20 21 graph.getAllConnectionConstraints = function (terminal: any ) if (terminal && graph.model.isVertex(terminal.cell)) { return [ new mxConnectionConstraint(new mxPoint(0 , 0.5 ), true ), new mxConnectionConstraint(new mxPoint(1 , 0.5 ), true ) ]; } return null ; }; (mxConstraintHandler as any).prototype.pointImage = new mxImage( "./point.gif" , 6 , 6 ); graph.setSelectionCell(newCell);
vertex和edge 编辑 1 2 3 4 5 6 7 8 9 10 11 12 13 14 15 16 17 18 19 20 21 22 23 24 25 26 27 28 29 30 31 32 33 34 35 36 37 38 39 40 41 42 43 44 45 46 47 48 49 50 51 52 53 54 55 56 57 58 59 60 61 62 63 graph.isCellEditable = function (cell: any ) return false ; }; graph.addEdge = function (edge, parent, source, target, index ) let newTargetField = fieldCell( createUniqueId(), `${source.value.code} ` , DataItemType.String ); addNewDataItem( DataItemType.String, source.value.code, source.value.name, newTargetField.value.mxcellId, target.value.mxcellId, false , false , source.value.mxcellId ); let newSourceField = fieldCell( createUniqueId(), `parentId` , DataItemType.String ); addNewDataItem( DataItemType.String, `parentId` , "外键" , newSourceField.value.mxcellId, source.value.mxcellId, true , false ); let model = graph.getModel(); let newTargetCell: any = null ; let newSourceCell: any = null ; model.beginUpdate(); try { newTargetCell = target.insert(newTargetField, target.children.length - 1 ); newSourceCell = source.insert(newSourceField, 1 ); } finally { model.endUpdate(); } GraphModel.buildConnection(target, source); setTimeout (() => { graph.setSelectionCell(newSourceCell); graph.setSelectionCell(newTargetCell); }); return mxGraph.prototype.addEdge.apply(this , [ edge, parent, newSourceCell, newTargetCell, index ]); };
设置vertex展示内容 1 2 3 4 5 6 7 8 9 10 11 12 13 14 15 graph.convertValueToString = function (cell: any ) if (cell.value != null && cell.value.name != null ) { return cell.value.name; } return mxGraph.prototype.convertValueToString.apply(this , arguments as any); }; graph.getLabel = function (cell: any ) if (this .isHtmlLabel(cell)) { var label = "" ; if (cell.value.type in diffLabel) { return diffLabel[cell.value.type](cell.value); } } return mxGraph.prototype.getLabel.apply(this , arguments as any); };
快速清空画布 1 2 3 4 5 6 function clearGraphCell (graph ) if (!graph) { return ; } graph.removeCells(graph.getChildVertices(graph.getDefaultParent())); }
获取画布连接线信息 1 2 3 4 5 function getGraphEdgeCell (graph ) let parentCell = graph.getDefaultParent(); let edgeCells = graph.getChildEdges(parentCell); return edgeCells; }
Swimlane节点 设置Swimlane全局可以链接 在mxgraph中 mxGraph.prototype.**hitsSwimlaneContent是用来判断,鼠标是否在swimlane内容中.
如果鼠标在swimlane内容上则它会返回true.
在鼠标选中拖拉连接线时会触发mxEdgeHandler.prototype.createMarker方法,这里面会校验处理.
1 2 3 4 mxGraph.prototype.hitsSwimlaneContent = function (swimlane, x, y ) return false ; };
展开/折叠节点 1 2 3 4 graph.isCellFoldable = function (cell ) return true }
自定义连接线样式 mxEdgeStyle中定义了线的各种样式: Loop、ElbowConnector、SideToSide等,可以通过一下方式定义连接样式:
1 2 3 4 5 6 7 8 9 mxEdgeStyle.MyStyle = function (state,source,target,points,result ) if (source != null && target != null ) { let pt = new mxPoint(target.getCenterX(), source.getCenterY()) if (mxUtils.contains(source,pt.x,pt.y)) { pt.y = source.y+source.height } result.push(pt) } }
定义好样式后,需要注册到mxStyleRegistry.
1 mxStyleRegistry.putValue('myEdgeStyle' , mxEdgeStyle.MyStyle)
最后使用mxGraphModel的setStyle方法将样式设置到指定的线上:
1
2
let e1 = graph.insertEdge(parent,null ,'连线' ,v1,v2)graph.getModel().setStyle(e1,"edgeStyle=myEdgeStyle" )
也可以直接修改连接线的样式:
1
2
let style = graph.getStyleSheet().getDefaultEdgeStyle().style[mxConstants.STYLE_EDGE]= mxEdgeStyle.MyStyle;
参考 https://korbinzhao.github.io/%E5%89%8D%E7%AB%AF%E5%BC%80%E5%8F%91/mxgraph/mxgraph-editor/2019/01/02/mxgraph-editor/
https://blog.csdn.net/White_Idiot/article/details/83016745
http://albertbamboo.cn/javascript/mxgraph/2017/09/10/mxGraph-example-01.html